Overview
The LV network assets – the transformers, distribution boards and the feeder cables – represent a significant percentage of the value of the entire network. Modelling of the network coupled with rudimentary metering (maximum demand indicators) has been the historic method of determining the loading on substations and their feeder cables. Errors in the network records is common with consumers being connected to different phases, different feeder cables or even different substations altogether compared to the records. This plus the introduction of low carbon technologies such as distributed generation and additional loads from electric vehicles and electrification of heating means modelling no longer provides a valid way of managing the network.
Renewing these LV assets is expensive and any replacement or reinforcement is typically just prioritised based on age, fault history or a superficial inspection.
How we can help
GridKey LV Monitoring allows information based decision making by recording the increase in loads, the detection of faults, voltage range etc. on each feeder from a substation. The resulting action from the data collected could be:
- To introduce some level of demand response
- Reconfigure the topology of the network to reduce the load on some feeders by moving to a less loaded circuit
- Replacement of cables and substation assets (transformer and distribution board)
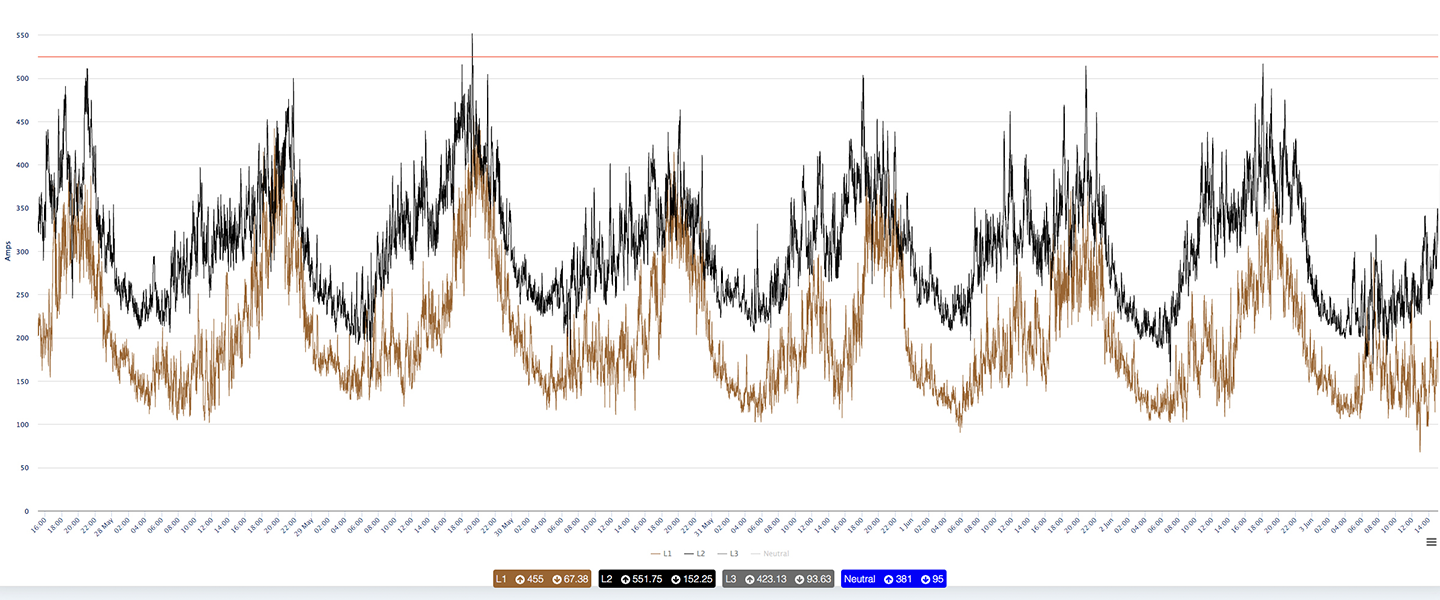
The example below shows a weeks load current at a small transformer, the daily usage pattern being clearly visible with high loads in the evening. The red line shows the nominal maximum rating of the transformer. Although getting close to the maximum rating for a short period of time each day the average overall loading is less. However adding electric vehicles charging at the peak time in the evening would push the transformer over limits. This will cause the transformer to operate at an elevated temperature for a period each day considerably reducing its life.